Many published articles discuss the benefits of using Continuous Integration/Continuous Delivery (CI/CD) in software development. One benefit would be improved code quality with bugs found earlier in the development life cycle. Another is that bug fixes can be delivered to customers more quickly. And yet another is that new features are delivered when ready rather than having to wait for the next major release cycle. Although CI/CD offers many advantages, making the transition from traditional development can be tricky. The transition is a journey. It is replete with rocky roads, peaks, and valleys. Also, it does not come with a map.
Some of you have already made this journey or some are just starting. As mentioned in a previous post, SAS recently transitioned to a CI/CD approach. We moved from a single daily build of software to multiple builds per day, consisting of several stages modeled around automation and quality. In this post, I will discuss some of the challenges we faced with accelerating the delivery of our software. Then I will share how collaboration and creating a new tool helped us traverse the CI/CD experience more effectively and efficiently.
CI/CD challenges: The journey begins
A major benefit of CI/CD? Quick turnaround on the validation of current software with automated builds and automated test execution in a pipeline.
A big challenge? Quickness also implies failing fast and failing often. Although that could sound negative, it’s actually a CI/CD principle that evokes the embracing of failures so you can learn from them and continually improve. Since the builds are occurring multiple times per day, there are now multiple times during the day when something can negatively impact the build. These could include areas such as hardware issues, connectivity issues, new containers being added, and new code being introduced. Multiple moving parts equals multiple points for possible failures.
The beginning
At SAS, Jira tickets are automatically generated for tracking problems discovered by our CI/CD pipeline. These tickets are often technically challenging to diagnose and remediate. As the influx of Jira tickets continued to rise, SAS realized the necessity of building a cross-divisional and cross-expertise triage team. The team consists of developers, testers, IT staff, and others who collaborate on ways to minimize the mean time to remediation (MTTR).
We use several products to assist us in the CI/CD journey. These include Jira (for tracking issues), Grafana (dashboards about cluster health, CPU usage, memory usage, and so on), and Kibana (a user interface for searching deployment logs), just to name a few. But given all of that, where do you start when you are investigating a ticket? Which of the products should you use? What should you look for? How do you identify the most common issues and relieve developers and testers from time-consuming diagnosis of potentially non-software related tickets? Everyone on our team approached triaging these Jira tickets from different perspectives. It was that combined mix of ideas that started leading to a recognizable pattern in the triage process. And from this process, the internal tool getTicketInfo evolved.
A need to be filled
Several years ago, I watched the Disney® movie “Robots” with my kids. A quote from that movie stuck with me:
"See a need. Fill a need" - Bigweld (Robots)
If you have seen the movie, you are well acquainted with Bigweld’s motto. He believed that anyone could contribute to solving a problem. With SAS’ journey into a CI/CD world, that quote took on a life of its own.
As a principal developer in R&D on the Analytics Frameworks team, I represented our department on the newly formed triage team. The team consisted of developers from divisions throughout SAS, testers from those same divisions, managers, and people from the DevOps team. My initial goal on this team was to make sure that any tickets for Analytics Frameworks were immediately addressed and at a minimum triaged.
The triage process
After experiencing the CI/CD triage process, I observed my coworkers, inside the triage team and out, spending hours of their time often investigating the exact same issue. For anyone new to the CI/CD process and/or containerized deployments, often the errors will be exceedingly generic. You might have a failure at a specific time. Sometimes you have an error code to go along with it...sometimes you don’t. It soon became clear that our team needed a solution. We needed to have both a faster feedback loop and a faster MTTR. Now my goal expanded to help discover that solution.
Triaging a ticket could be time-consuming with the thought process following a pattern like this:
- Is my container the problem?
- Or is it a functionality being tested by the container that is the problem? Do I need to search for information about other containers and their possible influence on the error I'm seeing? If so, which containers?
- Could it be a Kubernetes issue?
- Is it a problem with the infrastructure? How do I prove it?
So, imagine multiple members of the triage team using this thought pattern. Initially finding answers to those questions meant manually digging through logs, trying to find the right search query for Kibana, or finding the related dashboard in Grafana that would help identify the root cause. There had to be a better solution.
A continuous solution
A “solution” implies completion. In the CI/CD world, “Continuous” is the hallmark word. There will always be another challenge to overcome. As a result of overcoming several challenges within the initial CI/CD transition, team members posted gems of data in our daily scrums. They included links to Grafana for CPU and memory usage data, links to the most commonly helpful Kibana searches, Kubernetes information, and so on.
These links had to be manually modified for each deployment. However, they were already helping to lessen the time it took to triage each ticket. I decided it would help to automate the process of making the links ticket-specific, and along with that include commonly needed data from Jira (using Jira’s REST API), plus more links to other logs and summary tables. The end result was the tool we named getTicketInfo.
The tool getTicketInfo requires the Jira ticket ID as input. It uses that ID to generate a simple no-nonsense, no-frills report as shown in Figure 1. The report provides access to a wealth of information about that ticket and the deployment from which that ticket was generated… all in one convenient place.
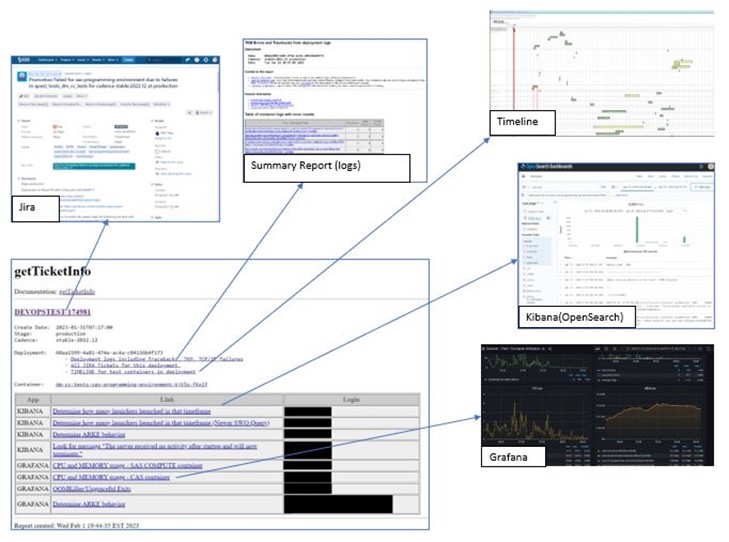
All about the report
In the report you can:
- Click on the ticket id to enter Jira and review the attachments, comments, and description for the generated ticket.
- Select “All Jira Tickets for this deployment” link and find out how many tickets were entered on that deployment’s behalf (often an exceedingly high number of tickets indicates an infrastructure issue rather than an actual software development issue).
- Review CPU and memory usage at the time of the failure by clicking on the supplied Grafana links.
- Check Kubernetes OOM killer (out of memory killer) behavior at that time to see if the affected container was unceremoniously shut down.
- Select Kibana links to review various aspects of the deployment.
- Select the deployment logs link to review what was going on in other containers during the time of the failure.
The tool is continuously evolving. One of the first additions was the timeline report from a coworker who integrated the log data into a visual timeline. You can quickly see exactly what containers were active at the same time and any significant errors as they are flagged in red. Possible issues are tagged in yellow. Next, an overall summary of all deployments was added, including timeout indicators and pod restart data.
The CI/CD journey continues
The CI/CD process is continually evolving. Here at SAS, we are excited to have embarked on the journey of CI/CD and getting new features and updates to our customers on a monthly cadence. Our previous process was measured in years! It’s not a trouble-free transition and takes commitment to the process from multiple divisions throughout the company. This collaboration results in continuous improvement.
The getTicketInfo tool is a prime example of that collaboration with members of our cross-divisional team. This tool has resulted in a significant reduction in triage time. This is particularly the case for the more commonly hit CI/CD issues where problems that had taken multiple man-hours had their MTTR reduced to minutes. Although the tool is an internal-only, I hope today’s blog post has at the very least been an interesting read. Maybe it will inspire you to look at your CI/CD process and find where you can “See a need, fill a need.”
Stay tuned for future posts including continuous monitoring and logging, continuous performance, continuous security, continuous quality metrics, and continuous everything.